Analysis of eukaryotic 18S rRNA gene short-read amplicon sequences, including OTU clustering, taxonomic identification and abundance profiling, tree construction, dissimilarity metrics, MDS, visualizations and screening for common pathogens. The client provides raw amplicon sequence data and sample metadata.
Log in to see availability and payment modalities.
▾ General introduction
Eukaryotic 18S metabarcoding is a genetic technique for surveying eukaryotic diversity in a variety of environments, ranging from soil, the ocean and groundwater to animal feces and the human gut.
A gene called 18S rRNA gene, shared by all eukaryotes but varying slightly between species, is used as a marker gene to identify which taxa are present in a sample and at which proportions.
In a single teaspoon of soil, for example, 18S metabarcoding can identify hundreds of distinct species, mostly microscopic eukaryotes, yielding a high-resolution microbial blueprint of each sample that can be used for statistical comparisons across treatments, space or time, for visualization of local biodiversity, or for the detection of potential pathogens.
Due to its relatively low cost and practicality, 18S metabarcoding is frequently used in large environmental surveys, for example to examine the ocean's microeukaryotic food web.
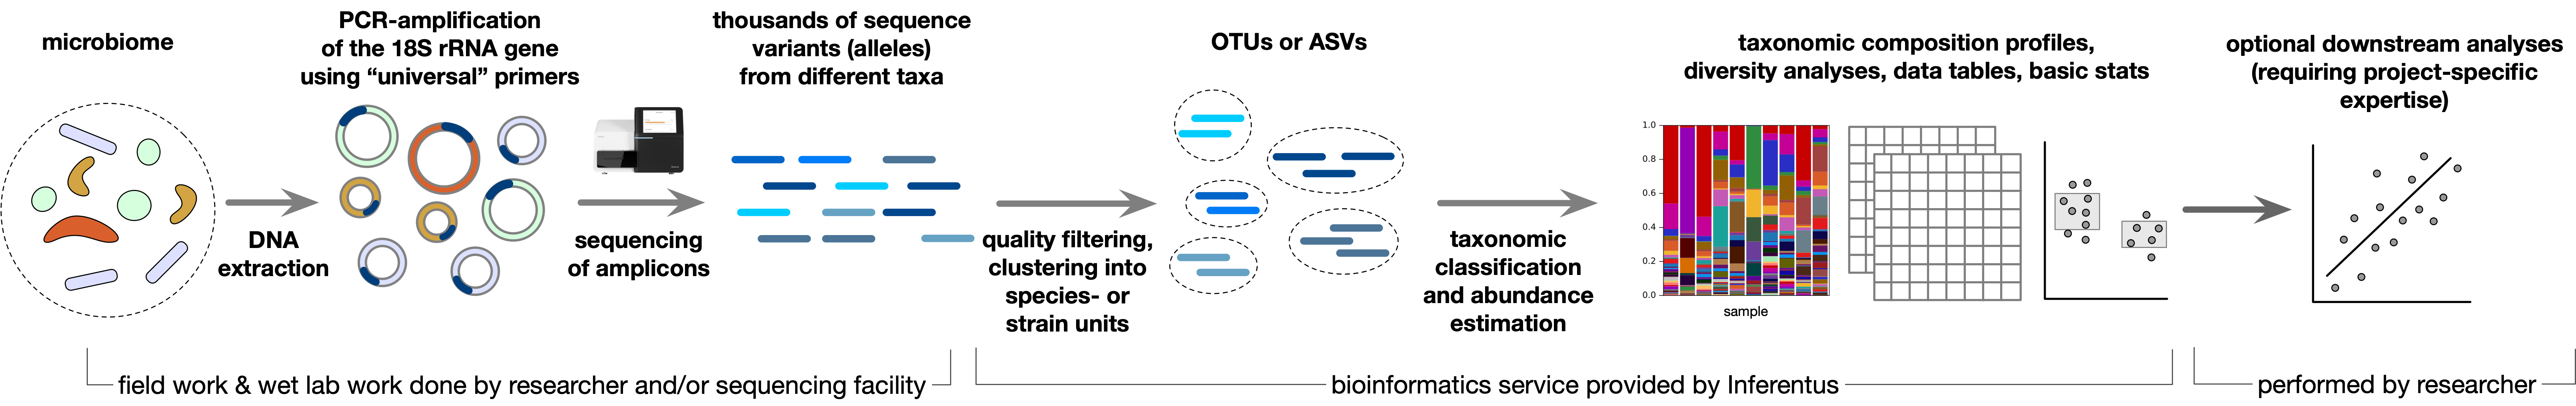
A typical 18S metabarcoding study proceeds in the following stages:
Collection of small amounts (<1 g) of material from each sample by the researcher.
Extraction of DNA from each sample using an in-house or commercial kit. This step is sometimes outsourced to an academic or commercial service provider.
Amplification of DNA fragments belonging to a specific region of the 18S rRNA gene using PCR, library preparation and sequencing of the amplified DNA. This step is commonly performed by an academic or commercial service provider. The most widespread technology is short read Illumina sequencing, which yields large numbers of sequences around 150-300 bp long.
Sequencing ultimately yields a separate set of DNA sequences for each sample, all covering the same region of the 18S rRNA gene, ranging from thousands to millions of sequences per sample. These data are commonly stored in fastq files, which are delivered by the sequencing service provider to the researcher.
Computational analysis of the sequences, including trimming and removal of poor quality (i.e., likely erroneous) sequences, clustering of similar sequences to reduce redundancy and identify species-like units called OTUs and strain-like units called ASVs, and estimation of the relative abundance of each OTU/ASV/taxon in each sample.
Statistical analysis, hypothesis testing and visualization of microbial community compositions. This step generally incorporates additional sample metadata, such as information about treatment groups, chemical measurements at each site, disease symptoms in human subjects, and so on.
We are eager to help you with your data analysis. Simply configure the analysis to your preferences, upload your raw sequences and any available sample metadata, and we can handle it from there.
▸ Overview of provided analysis
Our analysis starts with raw short-read Illumina 18S rRNA gene amplicon sequences, which are provided by the client and typically obtained from a sequencing service provider.
We deliver a summary report and key data products for presentations and downstream investigations.
Main steps and deliverables:
Basic quality filtering and trimming of sequences to improve overall data quality.
Inference of amplicon sequence variants (ASVs) using dada2 and OTU clustering at a user-specified similarity threshold using vsearch.
Optionally, chimeras may be detected and removed, a phylogenetic tree constructed for the ASVs, and ASVs thorougly mapped to SILVA to find closest matches.
ASVs and OTUs are taxonomically classified using a consensus approach based on the SILVA SSU reference database.
ASV and OTU tables are computed (TSV and BIOM format), listing the estimated relative abundances of each ASV and OTU in each sample.
Calculation of richness, Shannon-entropy and other α-diversity metrics for each sample and at each taxonomic level.
Multiple common pairwise dissimilarity metrics (aka. β-diversities) are computed between samples, measuring the differences in taxonomic compositions at various taxonomic levels (phylum to species, OTU and ASV level).
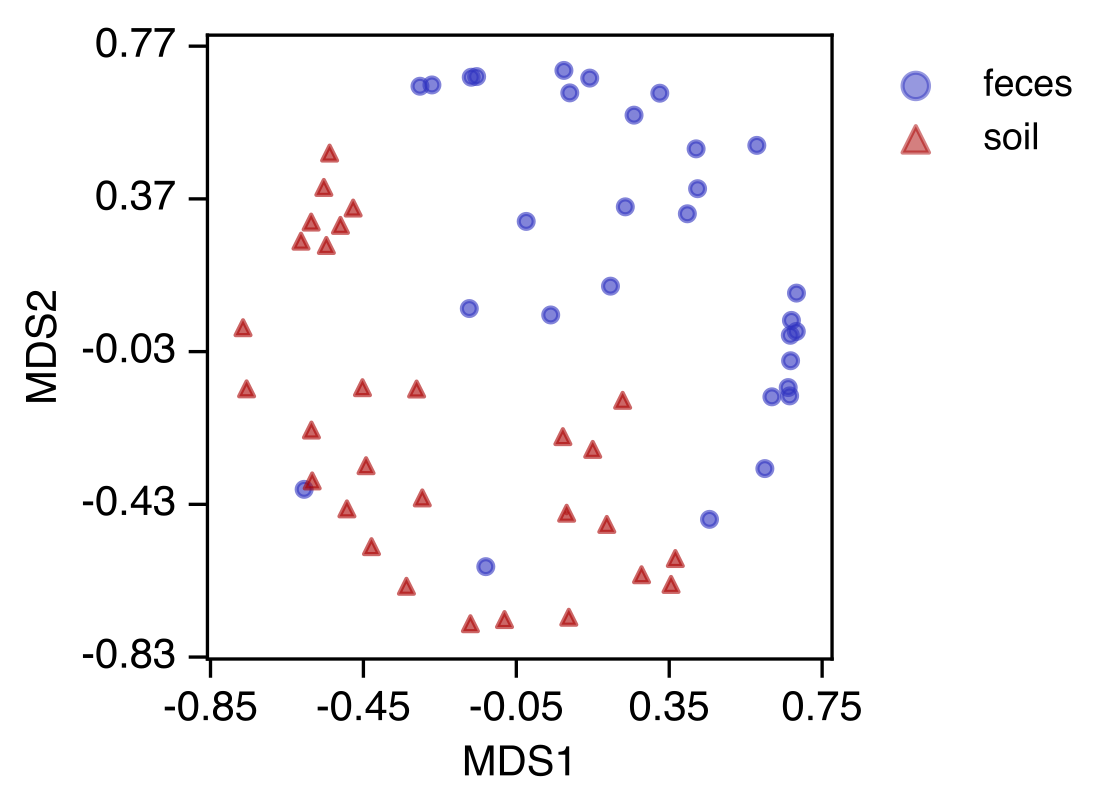
Two-dimensional multidimensional scaling is performed based on the pairwise dissimilarities.
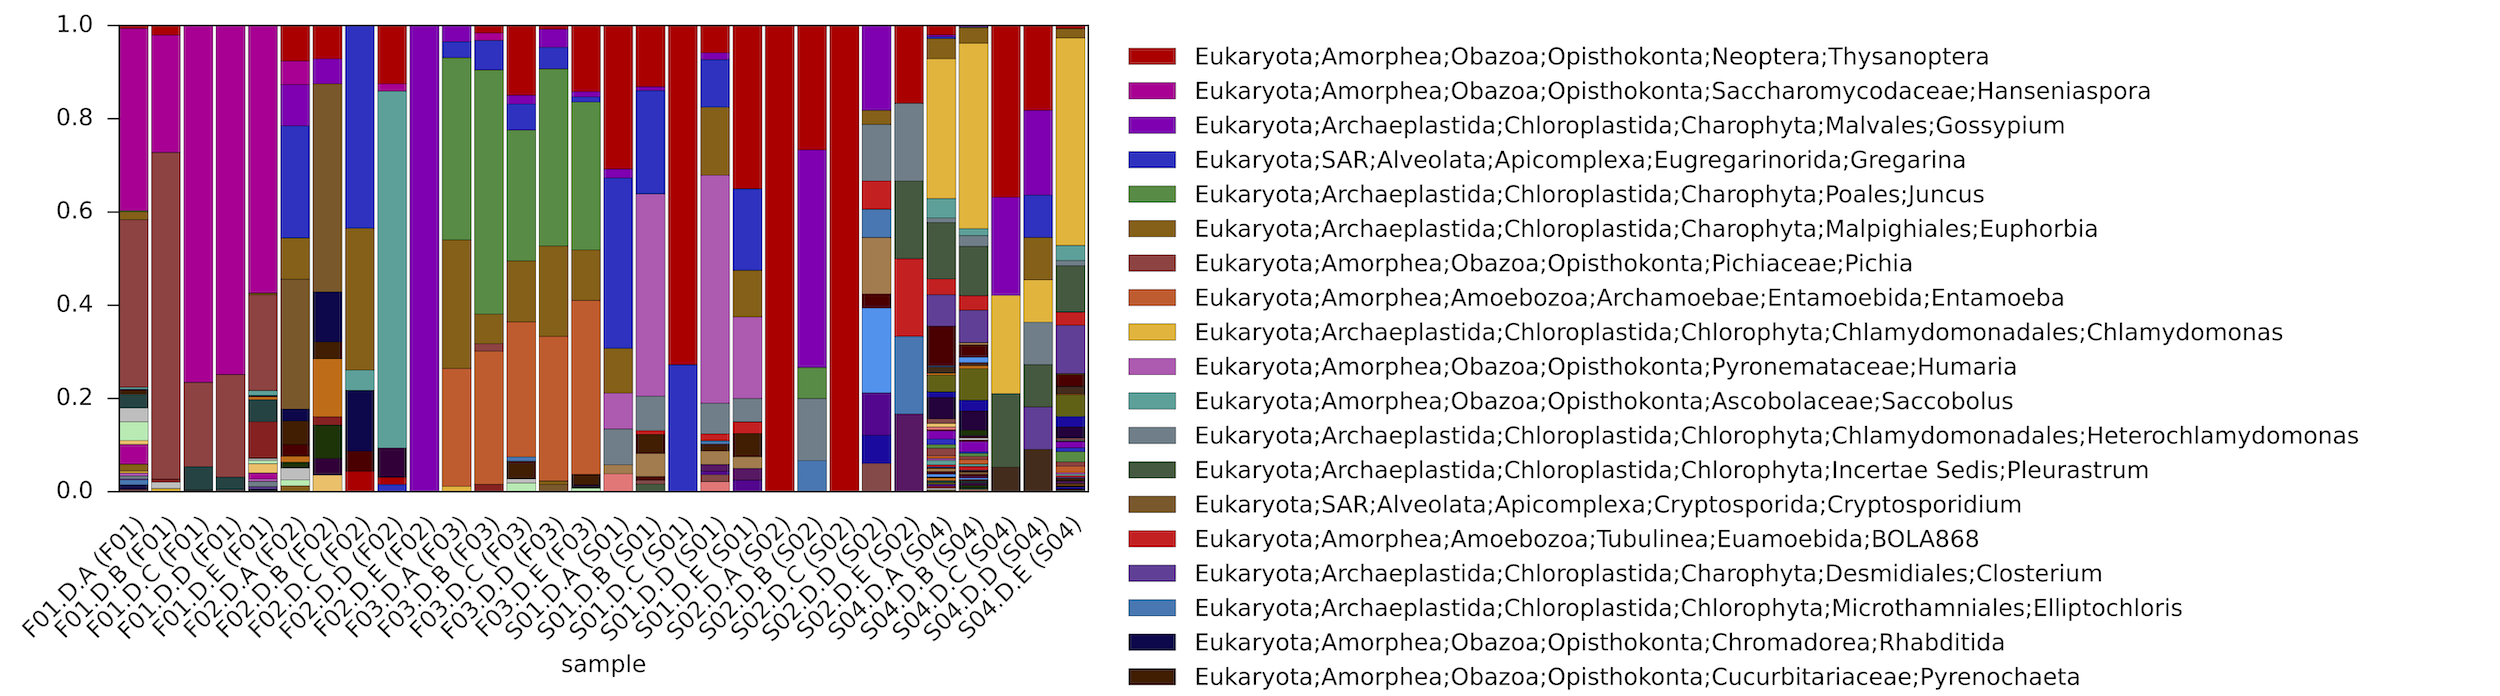
Common visualizations, such as barplots of relative ASV/OTU/taxon abundances, MDS plots.
In addition, we also provide a thorough Materials & Methods writeup for use in your publications.
▸ Input requirements
All sequence data must be generated on the same Illumina platform (for example, MiSeq or HiSeq2000), targeting the same region of the 18S rRNA gene (for example, V4) and using the same set of primers.
Sequence data must be provided as demultiplexed fastq files, one file per sample and per read direction. For paired-end reads, you will thus need to provide two fastq files.
Metadata must be provided for all samples in the form of a table file (e.g. CSV). This table must at the very least specify sample IDs and the fastq file names for each sample.
▸ Examples of data products
OTU_representative_sequences.fasta
Fasta file listing representative DNA sequences of inferred OTUs.
OTU_abundance_table.tsv
OTU abundance table, specifying the abundances (numbers of reads mapped) for each OTU in each sample.
OTU_taxonomic_assignments.tsv
Table listing the estimated taxonomic classifications of OTUs.
Genus_abundance_table.tsv
Table listing abundances (number of reads mapped) for each genus in each sample.
Dissimilarity_matrix_genus_abundance_jaccard.tsv
Table listing pairwise Jaccard dissimilarities between samples, in terms of their genus proportions.
▸ Examples of generated figures
×<>
▸ Used 3rd party resources
Main databases and software used in this analysis:
Price starts at $50 base + $5 per sample. Final price may differ depending on user settings, and will be available prior to order submission. Log in to see availability and payment modalities.